20. Scorecards
20.1. Description
A scorecard is a graphical representation of significance and performance of a comparison, normally a comparison between two models. The scorecard can only be produced using xml code. The xml code specifications are listed in the detail below. There is no GUI interface.
20.2. EMC vs. NCAR method of determining p-values for Aggregation statistics
In statistics, the p-value represents the probability of a statistic having a value at least as extreme as observed, in this case a difference between two models, given the null hypothesis that the two models come from the same distribution. When the p-values are large, there is evidence to reject this null hypothesis.
The EMC and NCAR methods of determining p-values are largely the same, though the output is quite different. Both are based on estimates of the mean and standard deviation of the statistic. Along with the sample size, the standard Student’s t value is calculated.When this value is compared with the known Student’s t distribution, the significance level (i.e. p-value) is determined. The first difference between the two methods is the identification of the appropriate alpha/2 value. In the NCAR version, this value is determined exactly using the statistic and the appropriate sample size. In the EMC version, an approximate lookup table for the Student’s t distribution is hard coded. Sample sizes are in four groups: < 20 cases, 20-40 cases, 40-80 cases, and > 80 cases. NCAR output contains the actual probability, while EMC output is grouped. Any non-significant differences are denoted by NA, significant differences fall into categories of 0.95, 0.99, and 1. Both systems use negative signs to denote a better statistic from the second model.
P-values can also be determined by bootstrapping using the percentile method. Cases (e.g. days) are randomly selected with replacement, then the difference between the statistics for two models is determined based on that sample. This process is repeated a large number of times, resulting in an empirical distribution of the differences. To find the p-value, the total percent of the bootstrap differences that are more extreme than the observed difference are calculated. This is the estimated p-value. The only difference here is that the difference is compared to a resampled distribution rather than a known, theoretical distribution.
20.3. Line Type
Scorecards can be run with either summary or aggregation logic. Aggregation logic is the default and generally, the better choice. The following are line types scorecards support:
CTC
SL1L2
SAL1L2
VL1L2
VAL1L2
PCT
GRAD
NBRCNT
ECNT
NBRCTC
RPS
20.4. How-To
The scorecard module is used to generate a scorecard PNG and HTML images using data in the METviewer database. The usage statement:
Usage:
mv_scorecard.sh scorecard_example.xml
where scorecard_example.xml is the XML that contains all of the scorecard specifications.
The scorecard_example.xml passed to the scorecard module contains information about the scorecard that will be generated. This XML can be downloaded from this link: scorecard_example.xml
<?xml version="1.0" encoding="UTF-8" standalone="no"?>
<plot_spec>
	<connection>
	  <host>db_host:3306</host>
	  <database>database_name</database>
	  <user>user_name</user>
	  <password>password</password>
	  <management_system>mariadb</management_system>
        </connection>

	<rscript>/usr/local/bin/Rscript</rscript>

	<folders>
	  <r_tmpl>path_to_R_tmpl</r_tmpl>
	  <r_work>path_to_R_work/</r_work>
	  <plots>path_to_plots_folder</plots>
	  <data>path_to_data_folder</data>
	  <scripts>path_to_scripts_folder</scripts>
        </folders>

	<plot>
	  <view_value>false</view_value>
	  <view_symbol>true</view_symbol>
	  <view_legend>false</view_legend>
	  <stat_flag>EMC</stat_flag>
	  <printSQL>FALSE</printSQL>
	  <stat>DIFF_SIG</stat>
	  <threshold_file>path_to_threshold_file</threshold_file>

	  <left_column_names>
	    <val></val>
	    <val></val>
	    <val></val>
          </left_column_names>

	  <template>scorecard.R_tmpl</template>

	  <plot_fix>
	    <field name="model">
	      <val name="PR4RN_1405"/>
	      <val name="GFS2016"/>
	    </field>
	    <field name="fcst_valid_beg">
	      <val name="2014-05-20 00:00:00"/>
	      <val name="2014-07-30 00:00:00"/>
            </field>
	    <field name="init_hour">
	      <val name="00"/>
	      <val name="12"/>
            </field>
	  </plot_fix>

	  <rows>
            <field name="stat">
	      <val name="ANOM_CORR" label="Anom Corr"/>
	      <field name="fcst_var">
		<val name="HGT" label="Heights"/>
		<field name="fcst_lev">
	          <val name="P250"/>
		  <val name="P500"/>
		  <val name="P700"/>
		  <val name="P1000"/>
	  	</field>
              </field>
            </field>

	    <field name="stat">
	      <val name="VL1L2_CORR" label="Anom Corr"/>
	      <field name="fcst_var">
		<val name="WIND" label="Vector Wind"/>
		<field name="fcst_lev">
		  <val name="P250"/>
		  <val name="P500"/>
		  <val name="P850"/>
	    	 </field>
	      </field>
	    </field>

	    <field name="stat">
	      <val name="ANOM_CORR" label="Anom Corr"/>
	      <field name="fcst_var">
		<val name="T" label="Temp"/>
		<field name="fcst_lev">
	          <val name="P250"/>
		  <val name="P500"/>
		  <val name="P850"/>
	        </field>
	      </field>
            </field>

	    <field name="stat">
	      <val name="ANOM_CORR" label="Anom Corr"/>
	      <field name="fcst_var">
		<val name="PMSL" label="MSLP"/>
		<field name="fcst_lev">
	          <val name="MSL"/>
	        </field>
	      </field>
            </field>

	    <field name="stat">
	      <val name="RMSE"/>
	      <field name="fcst_var">
		<val name="HGT" label="Heights"/>
		<field name="fcst_lev">
		  <val name="P10"/>
		  <val name="P20"/>
		  <val name="P50"/>
		  <val name="P100"/>
		  <val name="P200"/>
		  <val name="P500"/>
		  <val name="P700"/>
		  <val name="P850"/>
		  <val name="P1000"/>
	        </field>
	      </field>
            </field>

	    <field name="stat">
	      <val name="VL1L2_RMSE" label="RMSE"/>
	      <field name="fcst_var">
		<val name="WIND" label="Vector Wind"/>
		<field name="fcst_lev">
		  <val name="P10"/>
		  <val name="P20"/>
		  <val name="P50"/>
		  <val name="P100"/>
		  <val name="P200"/>
		  <val name="P500"/>
		  <val name="P700"/>
		  <val name="P850"/>
		  <val name="P1000"/>
	        </field>
	      </field>
            </field>

	    <field name="stat">
	      <val name="RMSE"/>
	      <field name="fcst_var">
		<val name="T" label="Temp"/>
		<field name="fcst_lev">
		  <val name="P10"/>
		  <val name="P20"/>
		  <val name="P50"/>
		  <val name="P100"/>
		  <val name="P200"/>
		  <val name="P500"/>
		  <val name="P700"/>
		  <val name="P850"/>
		  <val name="P1000"/>
	        </field>
	      </field>
            </field>

	    <field name="stat">
	      <val name="ME" label="Bias"/>
	      <field name="fcst_var">
		<val name="HGT" label="Heights"/>
		<field name="fcst_lev">
		  <val name="P10"/>
		  <val name="P20"/>
		  <val name="P50"/>
		  <val name="P100"/>
		  <val name="P200"/>
		  <val name="P500"/>
		  <val name="P700"/>
		  <val name="P850"/>
		  <val name="P1000"/>
	        </field>
	      </field>
            </field>

	    <field name="stat">
	      <val name="VL1L2_BIAS" label="Bias"/>
	      <field name="fcst_var">
		<val name="WIND" label="Wind Speed"/>
		<field name="fcst_lev">
		  <val name="P10"/>
		  <val name="P20"/>
		  <val name="P50"/>
		  <val name="P100"/>
		  <val name="P200"/>
		  <val name="P500"/>
		  <val name="P700"/>
		  <val name="P850"/>
		  <val name="P1000"/>
	        </field>
	      </field>
            </field>

	    <field name="stat">
	      <val name="ME" label="Bias"/>
	      <field name="fcst_var">
		<val name="T" label="Temp"/>
		<field name="fcst_lev">
		  <val name="P10"/>
		  <val name="P20"/>
		  <val name="P50"/>
		  <val name="P100"/>
		  <val name="P200"/>
		  <val name="P500"/>
		  <val name="P700"/>
		  <val name="P850"/>
		  <val name="P1000"/>
	        </field>
	      </field>
            </field>
          </rows>

	  <columns>
            <field name="vx_mask">
	      <val name="G2/PNA" label="N.American"/>
	      <field name="fcst_lead">
		<val name="24" label="Day 1"/>
		<val name="72" label="Day 3"/>
		<val name="120" label="Day 5"/>
		<val name="144" label="Day 6"/>
		<val name="192" label="Day 8"/>
		<val name="240" label="Day 10"/>
	      </field>
            </field>
	    <field name="vx_mask">
	      <val name="G2/NHX" label="N.Hemisphere"/>
	      <field name="fcst_lead">
		<val name="24" label="Day 1"/>
		<val name="72" label="Day 3"/>
		<val name="120" label="Day 5"/>
		<val name="144" label="Day 6"/>
		<val name="192" label="Day 8"/>
		<val name="240" label="Day 10"/>
	      </field>
            </field>
	    <field name="vx_mask">
	      <val name="G2/SHX" label="S.Hemisphere"/>
	      <field name="fcst_lead">
		<val name="24" label="Day 1"/>
		<val name="72" label="Day 3"/>
		<val name="120" label="Day 5"/>
		<val name="144" label="Day 6"/>
		<val name="192" label="Day 8"/>
		<val name="240" label="Day 10"/>
              </field>
            </field>
	    <field name="vx_mask">
              <val name="G2/TRO" label="Tropics"/>
	      <field name="fcst_lead">
		<val name="24" label="Day 1"/>
		<val name="72" label="Day 3"/>
		<val name="120" label="Day 5"/>
		<val name="144" label="Day 6"/>
		<val name="192" label="Day 8"/>
		<val name="240" label="Day 10"/>
	      </field>
            </field>
          </columns>

	  <agg_stat>false</agg_stat>
	  <boot_repl>1000</boot_repl>
	  <boot_random_seed>1</boot_random_seed>

	  <tmpl>
	    <data_file>scorecard.data</data_file>
	    <plot_file>scorecard.png</plot_file>
	    <title>METviewer Scorecard</title>
          </tmpl>
        </plot>
</plot_spec>
Here is an explanation for the sections:
<plot_spec>: This is the top level tag. It stands for “plot specifications”. Everything is defined in this tag.
<connection>: Please reference the Common XML Structures documentation.
<rscript>: Specifies the Rscript instance to use, for example /usr/local/bin/Rscript.
<folders>: A structure that specifies the input and output file system folders.
<r_tmpl>: The folder that contains the R templates used by METviewer, typically R_tmpl/ from the METviewer CVS source tree.
<r_work>: The folder that will contain the data and generated R scripts, must contain the sub-folder include/.
<plots>: The output folder that will contain generated image and HTML files.
<data>: The output folder that will contain generated data files.
<scripts>: The output folder that will contain scripts files.
<plot>: A structure that specifies scorecard characteristics.
<execution_type>: Rscript or Python, indicating whether to use Rscript or Python for the statistics calculation and plotting (if available). This is an optional element. The default value is Rscript.
<view_value>: TRUE or FALSE, indicating whether or not to display statistical values in the scorecard cells. The default value is FALSE (do not display).
<view_symbol>: TRUE or FALSE, indicating whether or not to display a symbol in the scorecard cells. The default value is TRUE (display).
<view_legend>: TRUE or FALSE, indicating whether or not to display a legend for the scorecard. The default value is TRUE (display).
<stat_flag>: NCAR or EMC, which algorithm to use to calculate statistics. The default value is NCAR.
<printSQL>: FALSE or TRUE, indicating whether or not to print SQL queries. The default value is FALSE (do not print).
<stat>: DIFF (display a difference between models) or DIFF_SIG ( display p_value ) or SINGLE (display a value of statistic for the 1st model. In this case the value of the 2nd model is optional. This mode works only for <agg_stat> true </agg_stat>), indicating which statistic to display for both - values and symbols - in the cell. The default value is DIFF_SIG (display p_value).
or
<stat_value>: DIFF (display a difference between models) or DIFF_SIG (display p_value) or SINGLE (display a value of statistic for the 1st model. In this case the value of the 2nd model is optional. This mode works only for <agg_stat> true </agg_stat>), indicating which statistic to use to display for values in the cell.
<stat_symbol>: DIFF (display a difference between models) or DIFF_SIG (display p_value) or SINGLE (display a value of statistic for the 1st model. In this case the value of the 2nd model is optional. This mode works only for <agg_stat> true </agg_stat>), indicating which statistic to use to display for symbols in the cell.
<threshold_file>: full path to the XML file describing configurations for thresholds, colors and symbols (optional).
<weight_file>: full path to the XML file describing configurations for weights definitions (optional).
<left_column_names>: a list of names for the most left columns as in <val>NAME</val> format.
<symbol_size>: a size for the symbols. It can be in ‘%’ or ‘px’. For example, ‘120%’ will increase the size of symbols by 1.2 times. ‘20px’ can also be used.
<template>: the name of the R plot script template to use. The following templates are currently supported: scorecard.R_tmpl.
<plot_fix>: describes database fields - models, date range and init hour - that are constant.
- Attributes
name: the database field name whose values are contained in the child tags equalize: TRUE or FALSE, indicating whether or not to include this field to the Event Equalisation case. The default value is FALSE (do not include)
Model field contains:
two values - first and second model names
one value - when the stat values for one model are requested
multiples pairs - for the aggregated scorecard
Date range can be specified using ‘fcst_valid_beg’ or ‘fcst_init_beg’ and contains one or more groups of two values - start and end dates. This example will create a scorecard for two periods (07-01 00:00 - 07-03 12:00) and (07-05 00:00 - 07-10 12:00)
<field name="fcst_valid_beg">
 <val name="2011-07-01 00:00:00"/>
 <val name="2011-07-03 12:00:00"/>
 <val name="2011-07-05 00:00:00"/>
 <val name="2011-07-10 12:00:00"/>
</field>
Init hour can contain one or more values.
Date/time fields could have <label>: attribute. It will be used in the title instead of on the list of dates.
For example, if ‘fcst_valid_beg’ example above had a label <field name=”fcst_valid_beg” label=”July 2011”>: Then the title would be
METviewer Scorecard
for PR4RN_1405 and GFS2016
July 2011
<field name="model">
  <val name="first_model"/>
  <val name="second_model"/>
</field>
<field name="fcst_valid_beg">
  <val name="start_date"/>
  <val name="end_date"/>
<!--optional second date range:-->
  <val name="start_date"/>
  <val name="end_date" />
<!--or optional single date:-->
  <val name="date"/>
</field>
<field name="init_hour">
  <val name="first_hour"/>
</field>
<rows>: Describes an individual row in the scorecard table. Contains 3 or more nested <field> elements.
<field>: Describes an individual row or row group in the scorecard table. Attributes:
name: Database field name
<val>: describes a value of the field. Fields can have more than one value element. Attributes:
name: Database field name
label: The label that shows up on the image
<field>: next level database field name. Field can have more than one field element
<columns>: describes an individual column in the scorecard table. Contains one or more nested <field> elements
<field>: Describes an individual column or column group in the scorecard table. Attributes:
name: Database field name
<val>: describes a value of the field. It can be a single value or a group of values separated by ‘:’. Fields can have more than one value element. Attributes:
name: Database field name
label: The label that shows up on the image
<field>: next level database field name. Field can have more than one field element
<agg_stat>: TRUE (bootstrapping) or FALSE (student-T/normal), indicating whether or not to create a scorecard using aggregated statistics. The default value is TRUE (use bootstrapping).
<boot_repl>: number of bootstrapping replications, use 1 for no bootstrapping. Used when <agg_stat> is TRUE.
<boot_random_seed>: value of Random.seed for bootstrapping to get reproducible random results. Used when <agg_stat> is TRUE.
<plot_stat>: name of the aggregation statistic. median or mean. The default value is median.
<tmpl>:
<data_file>: name of the R data.frame data file, inside of the <r_work> folder specified above
<plot_file>: name of the output image file, inside of the <plots> folder specified above.
<title>: title of the scorecard displayed on the image. Default value: Verification Scorecard
20.5. Example
The image below shows the output of scorecard_example.xml.
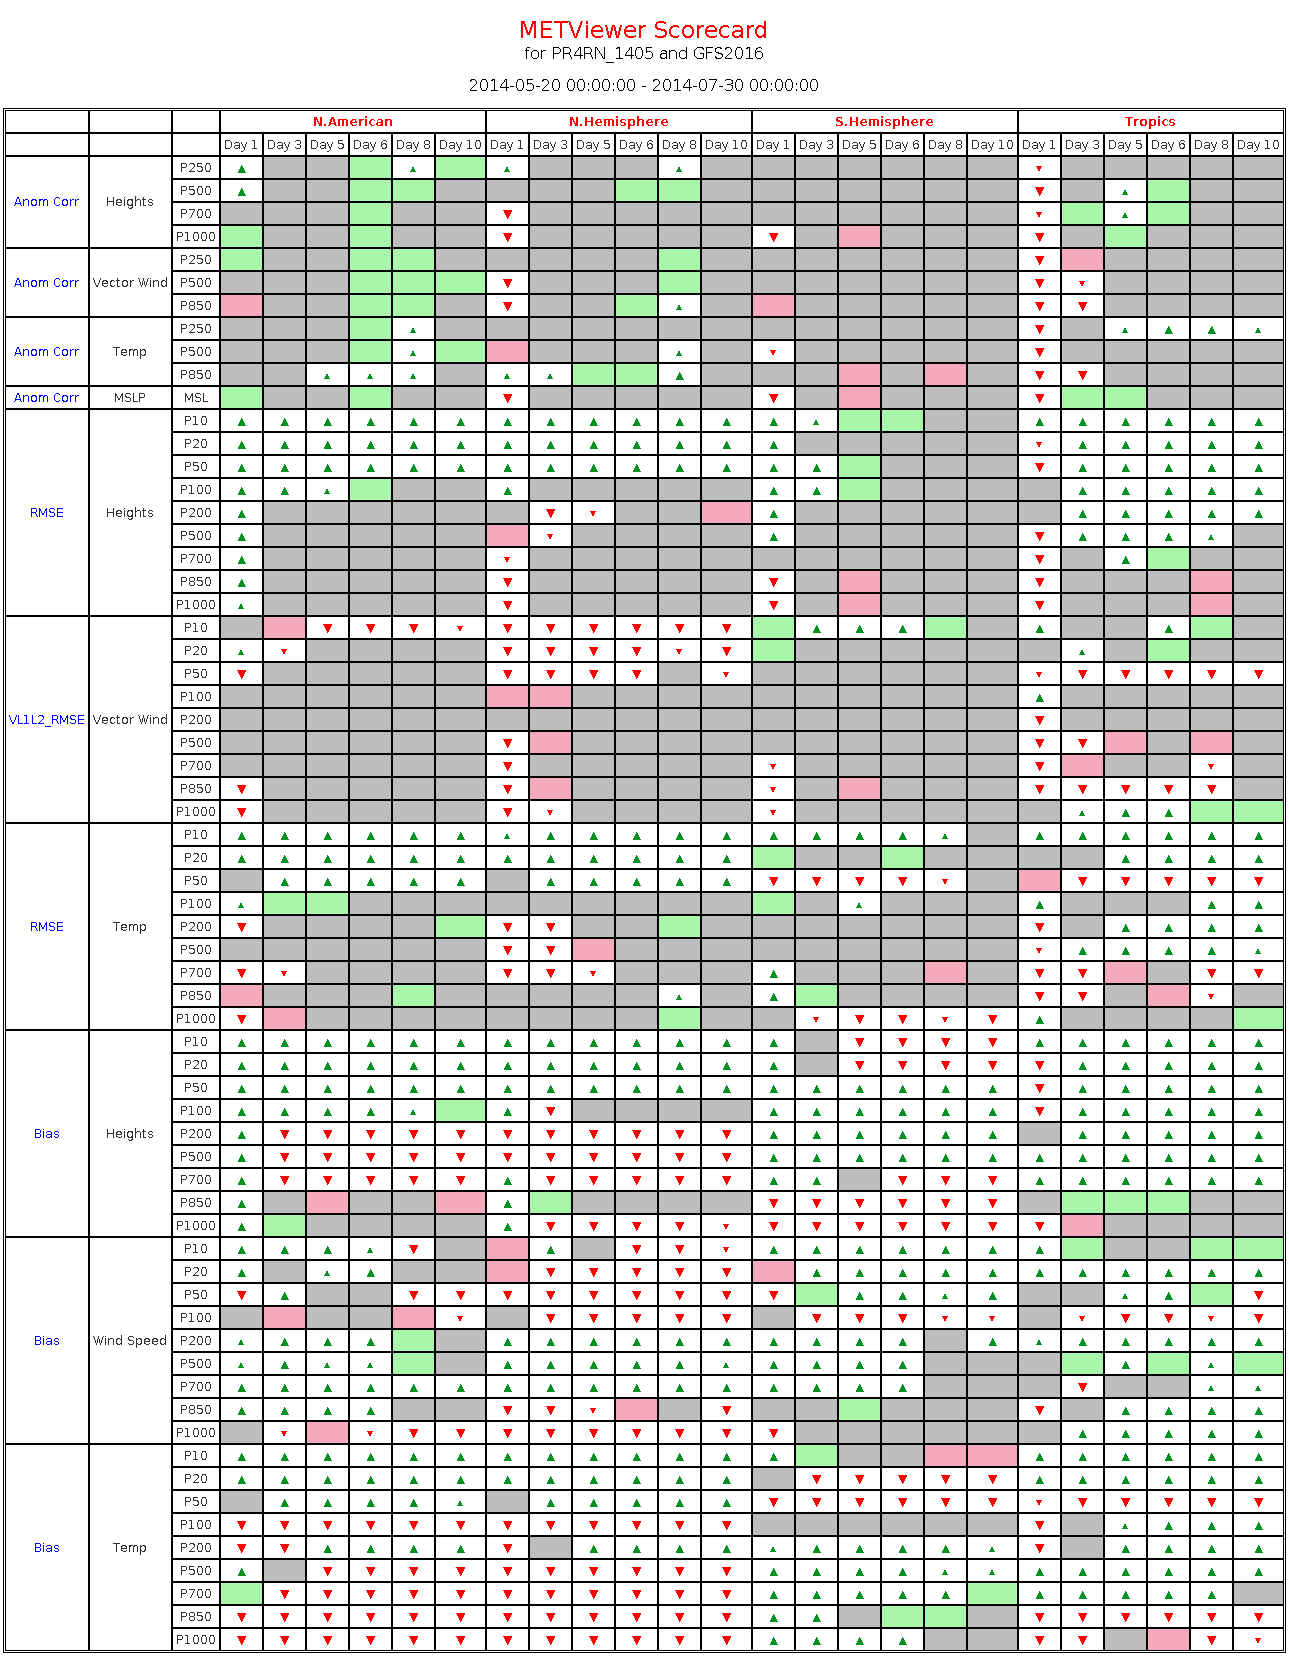
Figure 20.1 Scorecard output example.